From Analytics Team
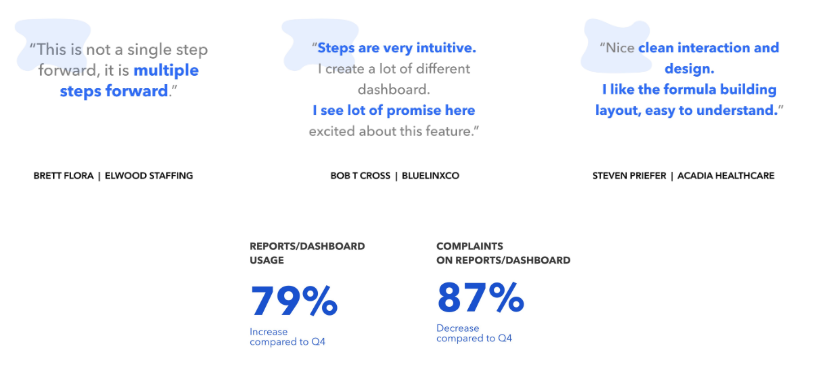
Increase the Dashboard Usage by at least 50%
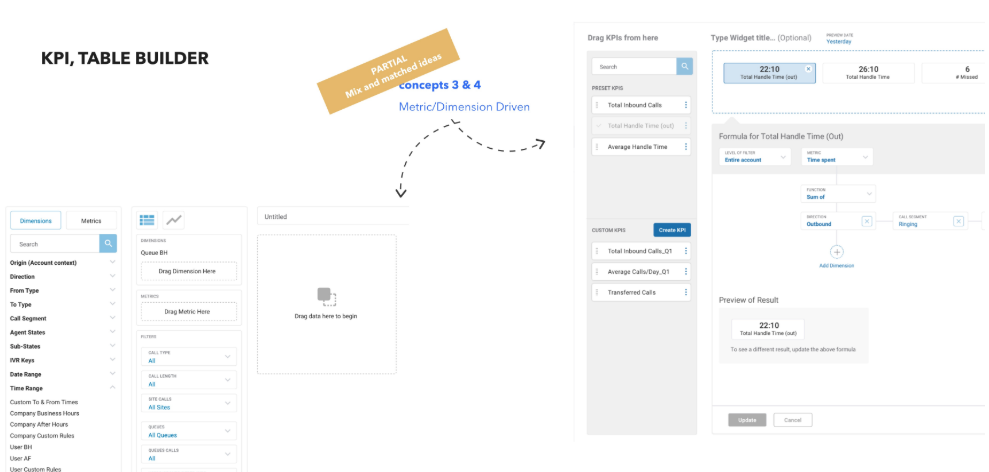
LOB - Line of Business Analytics, KPI Table Builder
Scroll ↓
So what PROBLEMS are we trying to solve?
Pre-built dashboards One size doesn't fit all
Doesn't offer the necessary coverage
Not customizable, scalable, flexible
Frustrated and unsatisfied users
Decrease in dashboard usage

What are the GOALS?
More customizable, scalable, flexible
Decrease user complaints. Retain users
Increase usage of business analytics
Focus on JTBDs
- Call center manager wants to evaluate call handling by agents
- Marketing manager wants to track time spent on certain meetings
Where to START?
Gathered user complaints about dashboards
Categorized and analyzed all the feedback from users
Conducted user interviews
Collaborative work alongside the PM
Focused on pain-points, improvements on product features, why and when the reports were used, most important reports

Solutions
- Pain relievers
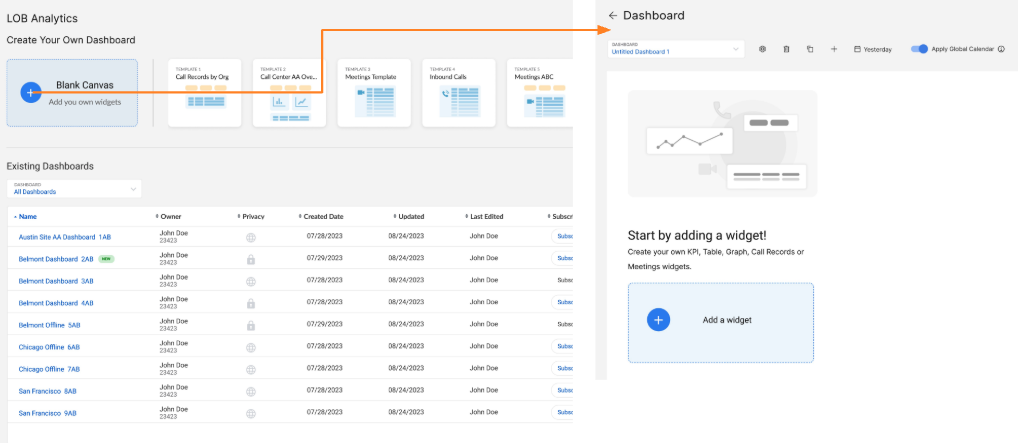
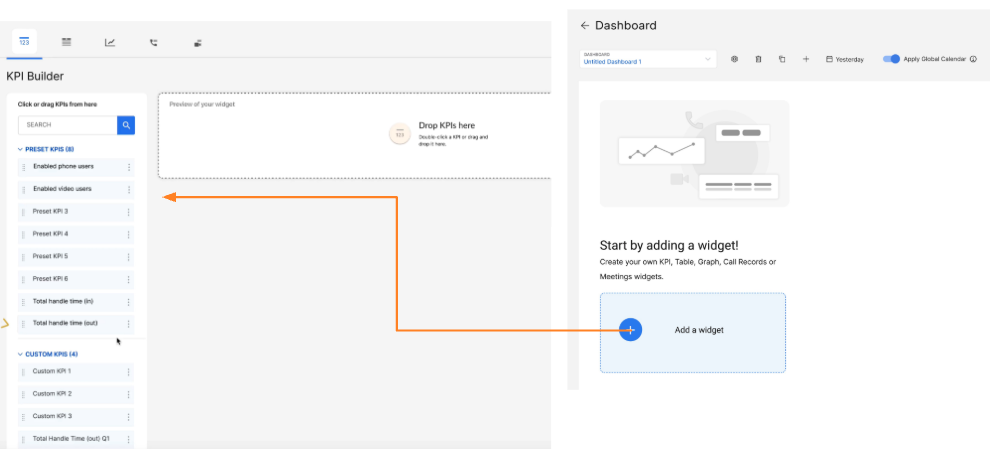
Provide building blocks to create custom Dashboard with custom KPIs, tables and graphs which are flexible and scalable
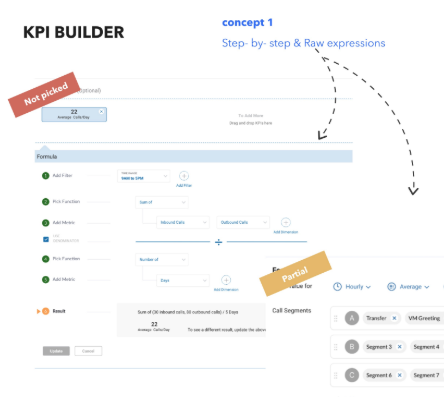
Guide the users to build widgets and dashboards through Intuitive step-by-steр process
Simple enough for a non-technical business users to build widgets and dashboards
Research
- How others do it
Competitive Analysis - Report builders, dashboards, graphs, KPIs and tables
Research on other non-competitor products to understand trend, workflow, product features, etc.,
Reviewed the findings with PMs to refine the requirements
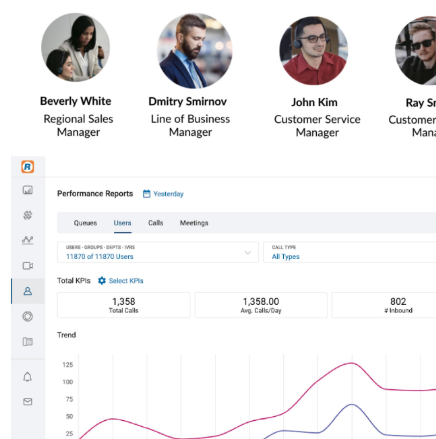
Designs